Comparison of Conventional and Membrane Treatments
| Characteristic | Membrane Treatment | Conventional Treatment |
|---|---|---|
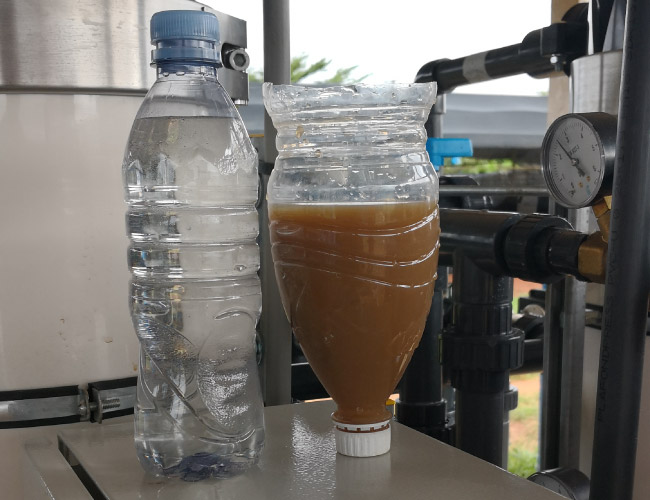
| Treatment Quality | Effluent quality is not impacted by changes in quality of source water | Is impacted by changes in the influent quality of source water |
| Filtration | Absolute filtration | Questionable due to irregular sand size and distribution |
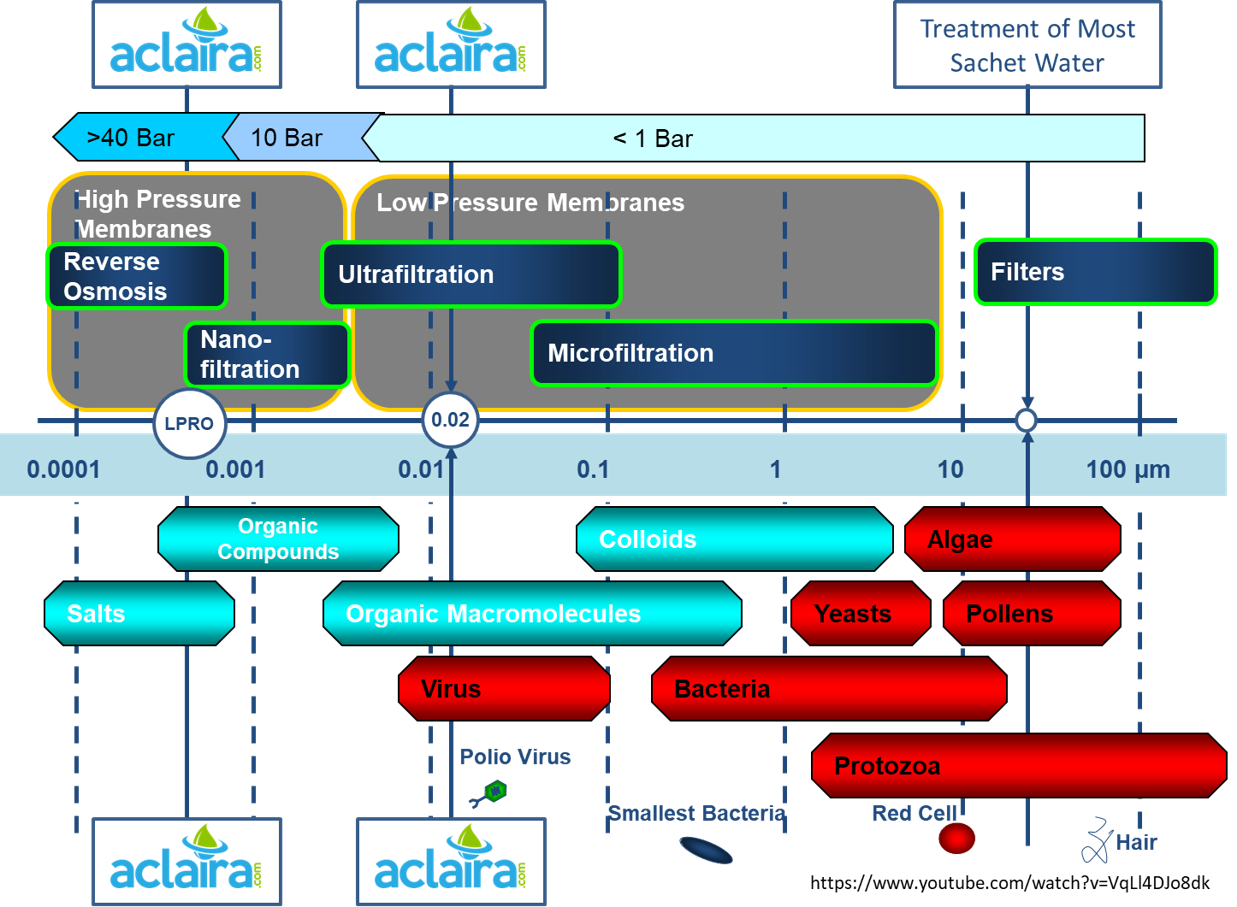
| Reduction of Microorganisms | 6 log for bacteria 4 log for viruses (ultrafiltration) |
Poor elimination of microorganisms |
| Turbidity | < 0.1 NTU | Variable output turbidity |
| Recovery | High, up to 98% | Lower recovery rates |
| Footprint | 2 to 5 times smaller | Larger footprint due to long retention times |
| Sludge Disposal | No sludge disposal issues | Problems due to the use of coagulants |
| Chemical Use | Minimal | Chemicals used in larger quantities increase formation of disinfection by-products (DBPs) |
| Operation | Often a single simple step | Complex multi-step processes |
| Remote Control | Easy | Difficult to manage remotely |
| Disinfection By-Products (DBPs) | Low concentration and total reduction possible | Produced in large quantities and not eliminated |
| Endocrine Disruptors | Reverse osmosis, durable and proven barrier | Doubts about the effectiveness of activated carbons |
| Per- and Polyfluoroalkyl Substances (PFAS) | ||
| Compliance | Meets all WHO recommendations for drinking water | Cannot meet all requirements |


